
The Map the Canopy page is an online mapping tool that highlights data collected by the Canopy Network and our partners since 2013.
Users can now view regional urban heat data provided through a Heat Watch Study conducted with CAPA Heat Watch and Portland State University in August 2019.
Who should use it?
Anyone from residents to planners to community leaders can use this tool to see an interactive map that showcases the impacts of our region’s tree canopy.
What do you see?
Each data layer represents the impact of urban trees on our communities.
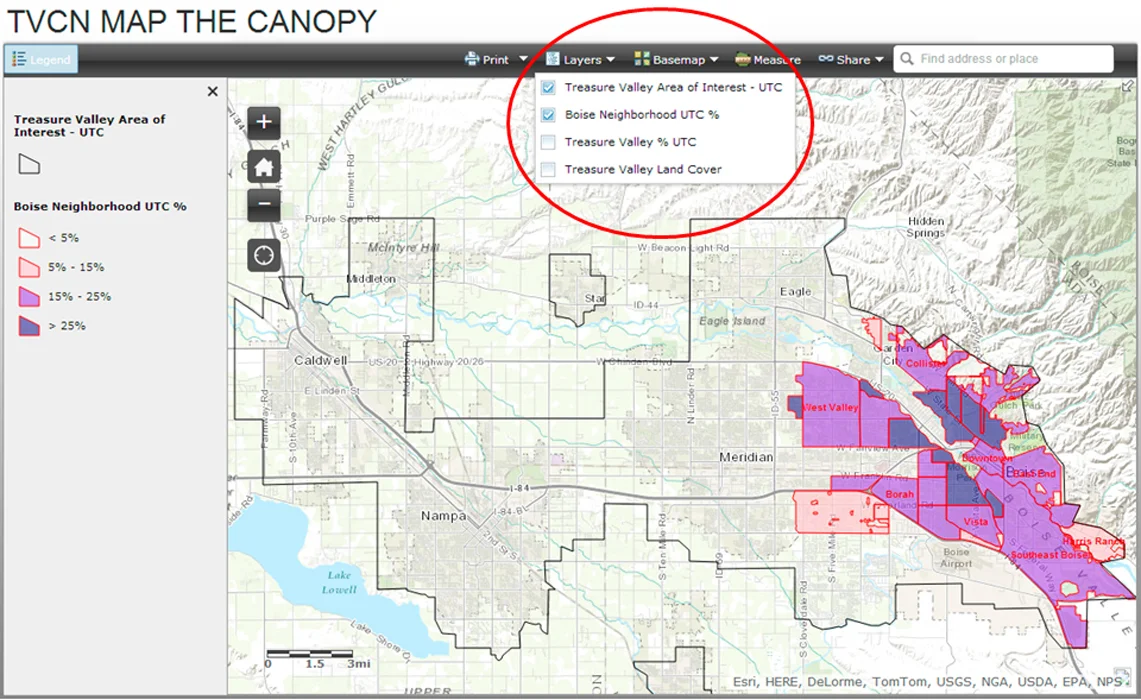
City of Boise Neighborhood Associations - Outlines the neighborhood associations within the City who are engaged in grassroots community planning efforts. These organizations are vital partners in improving tree canopy.
Treasure Valley Area of Interest UTC - The area surveyed by Plan-It Geo and Idaho Department of Lands for the original 2013 urban tree canopy (UTC) assessment.
Treasure Valley % UTC - summarizes tree canopy data at the census block level
**NEW IN SEPTEMBER 2020** Urban Heat Measurements (Morning, Afternoon and Evening) for Boise and Nampa - These are the results of an urban heat watch study completed in partnership with Portland State University and CAPA Heat Watch.
Treasure Valley Shade Trees - showcases the number of shade trees planted per census block since 2013. The shade trees planted will mature over time to provide benefits to homeowners, including reduced summer energy costs.
Treasure Valley Land Cover - depicts raw tree canopy data by mapping individual trees
Users can also click on each layer in the map to find out more information about that layer.
What can you learn?
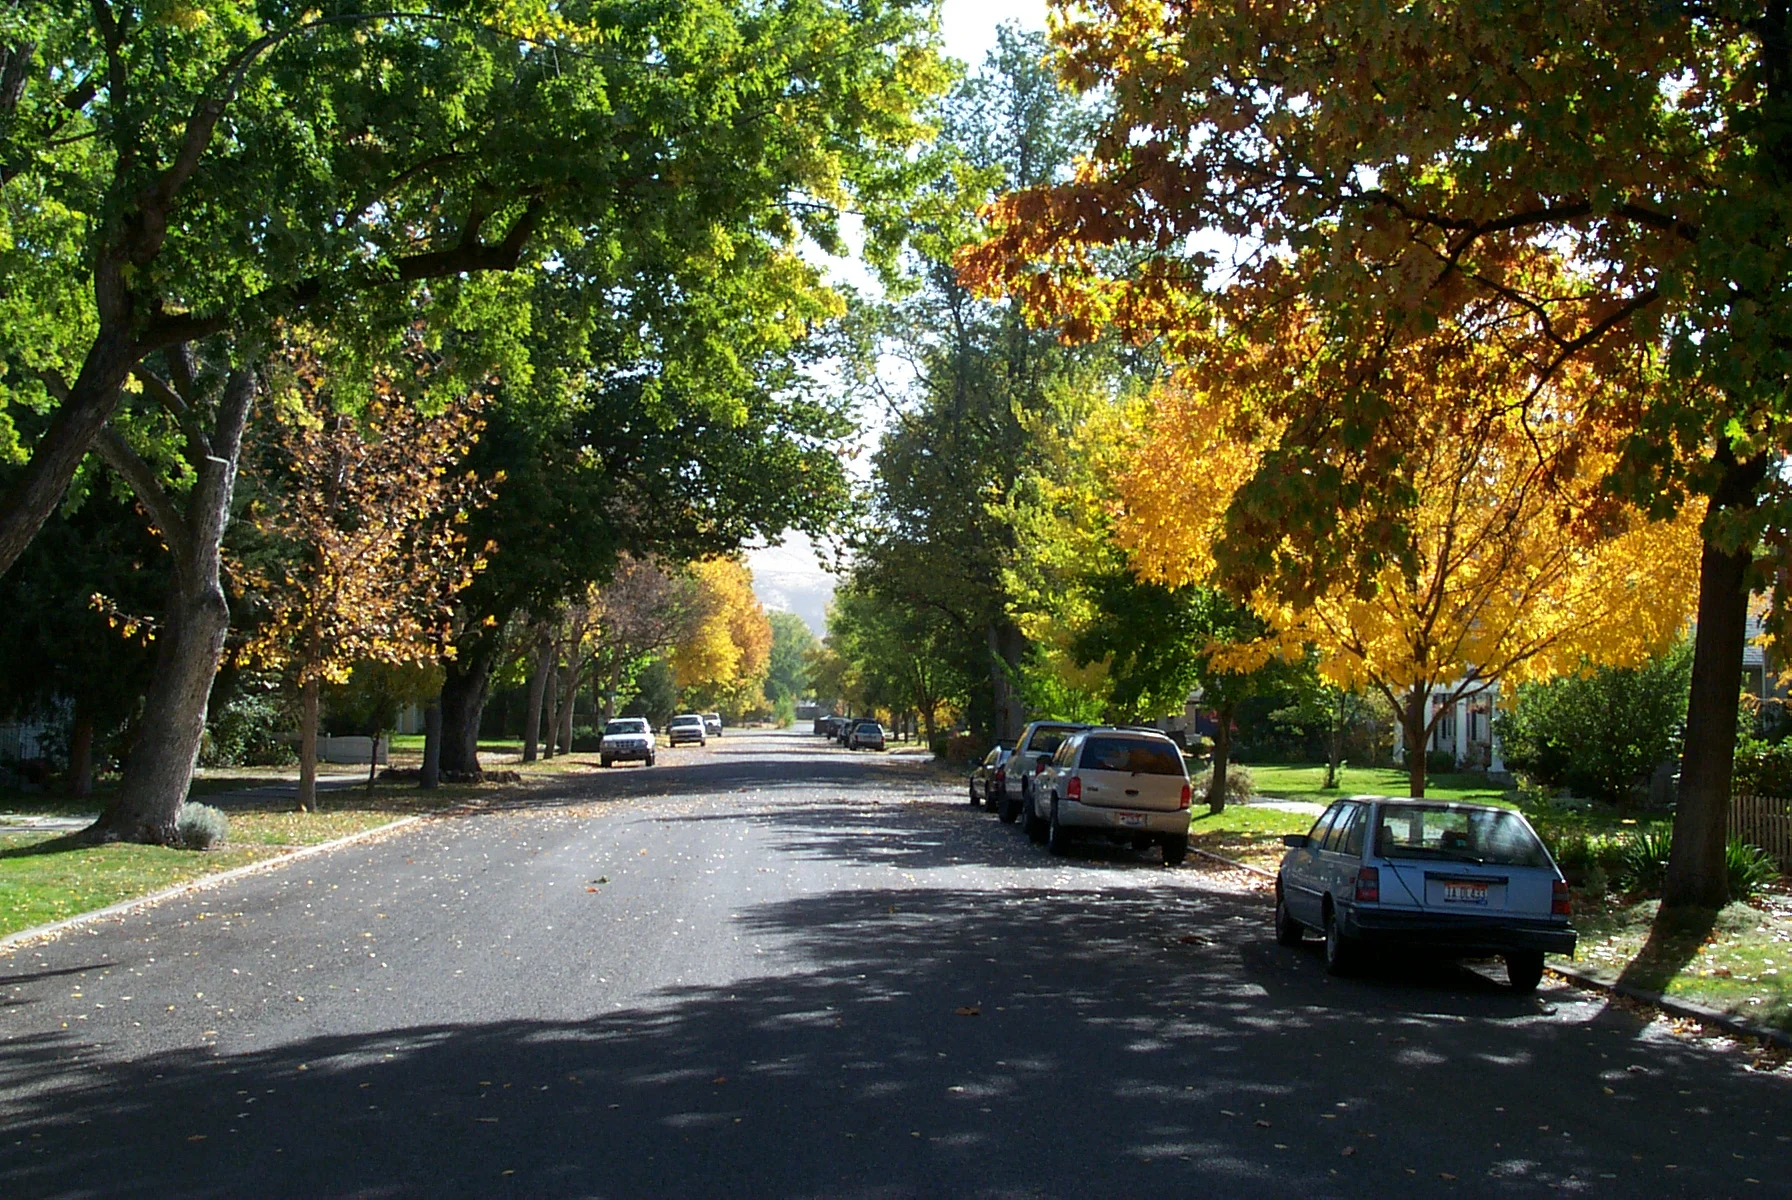
Users can learn what percent tree canopy looks like at an individual residence, neighborhood or city level. They can also visualize what tree canopy looks like from a local to regional scale.
Stay aware of updates
This map will be updated periodically with additional functions. Follow us on our various social media outlets for periodic updates.
Here are a few tips:
CHANGE YOUR LAYERS OR BASEMAP:
VIEW LAND COVER:
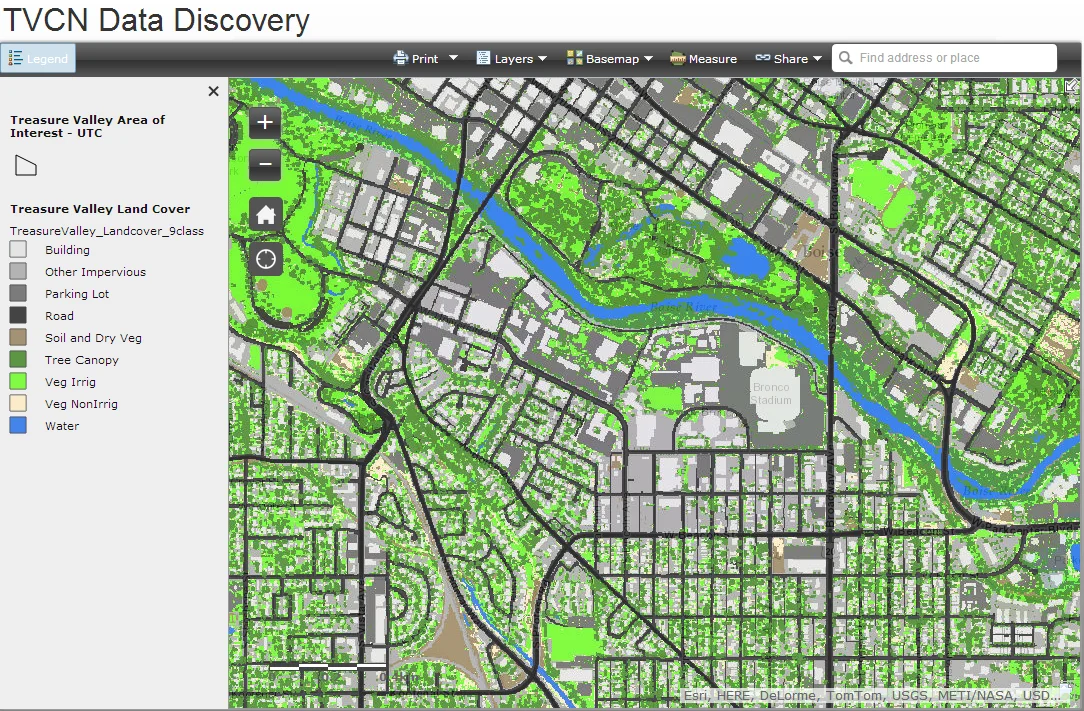
Land cover for area around Boise State University, Ann Morrison Park, Julia Davis Park and Boise's Central Addition.
VIEW URBAN HEAT IMPACTS

Urban Heat Watch data highlights the impact of areas with low tree canopy on urban heat within the city.